RibolytixProject Viewer

Ribolytix platform

Measure protein-RNA interaction states

We employ novel liquid chemistry approaches to enable complementary analyses of RNA and protein interactors.

Ribolytix Platform

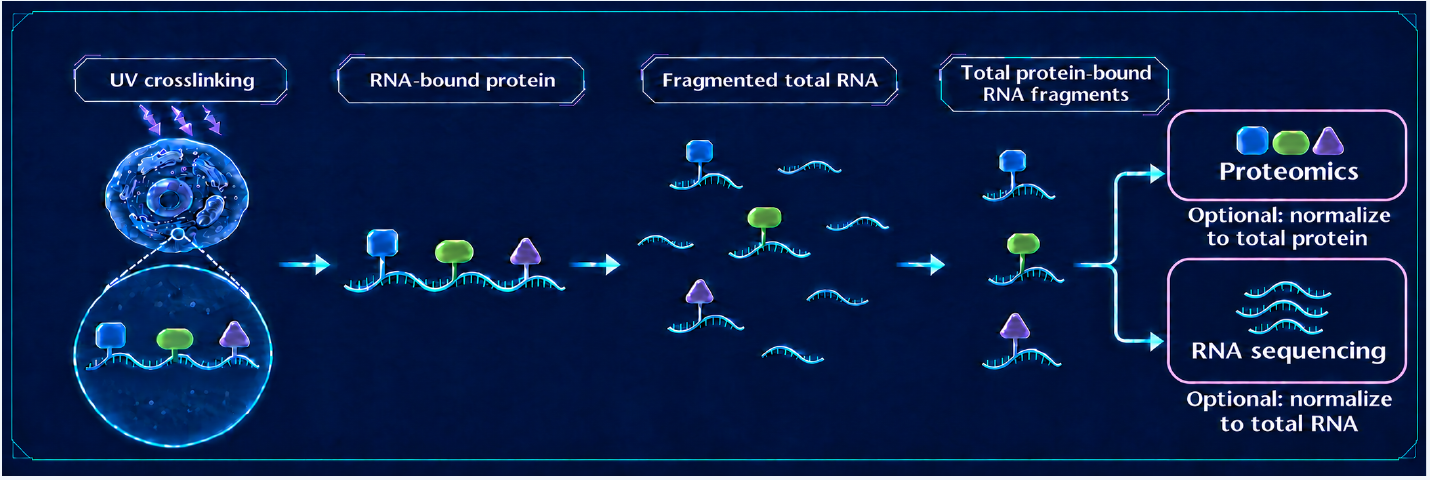
Platform diagram showing UV crosslinking, RNA-bound protein, fragmented total RNA, and total protein-bound RNA fragments, followed by proteomics or RNA sequencing.

Platform Readouts

RNA-interaction levels

RNA-bound protein abundance

Protein occupancy levels

Protein-bound RNA abundance

Use Cases

Compound and disease profiling for RBP marker identification
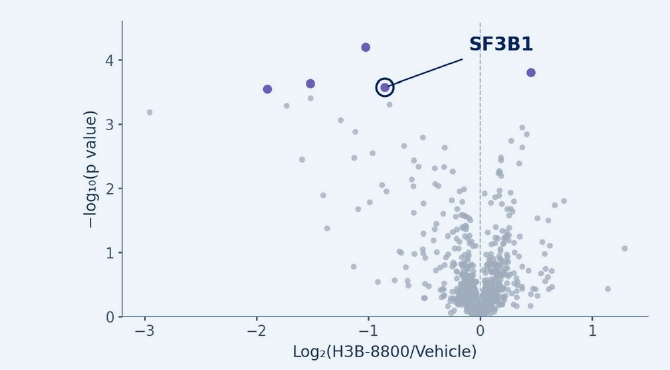
Volcano plot of H3B-8800 versus vehicle, highlighting SF3B1.

H3B-8800 inhibits SF3B1.

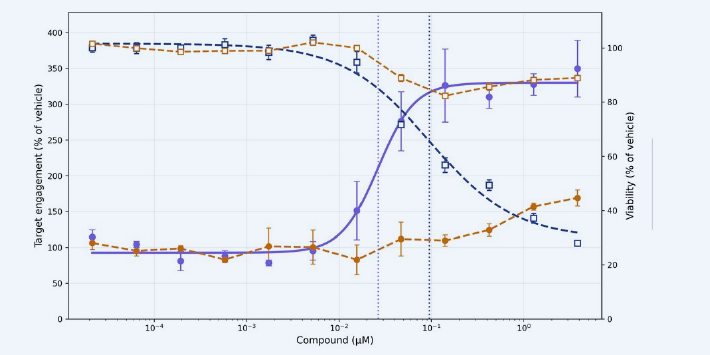
Dose-response profiling to measure target engagement in cells

Dose-response plot comparing an RBP marker at 30 minutes and viability at 24 hours in two cell lines.

● Cell line A   ● Cell line B (RBP marker, 30 min)
□ Cell line A   □ Cell line B (viability, 24 hr)
Cell line B: no 4PL fit accepted.
Working With Ribolytix

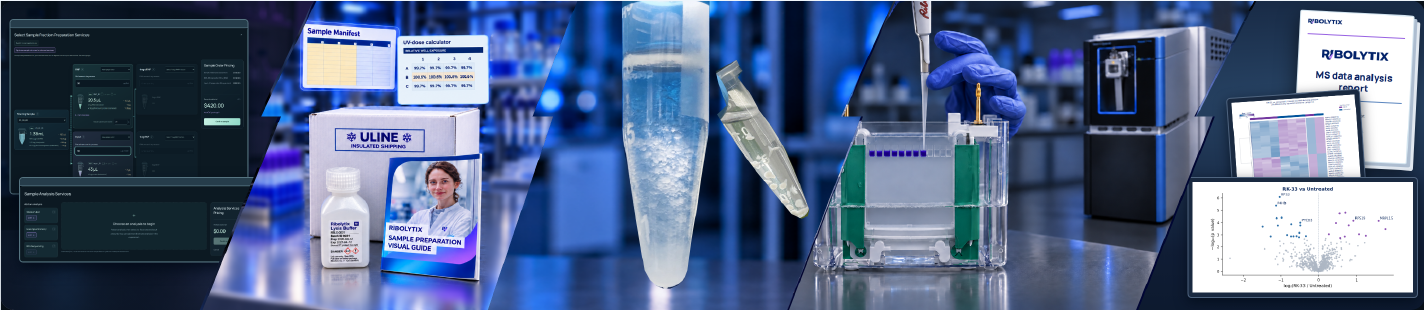
Project planning, sample preparation, laboratory analysis, and data reporting.

Project planning tools, transparent pricing, flexible sample preparation and analysis, and comprehensive data reporting with traceable results.